
Executive view
We expect a deeper decline before the next rebound
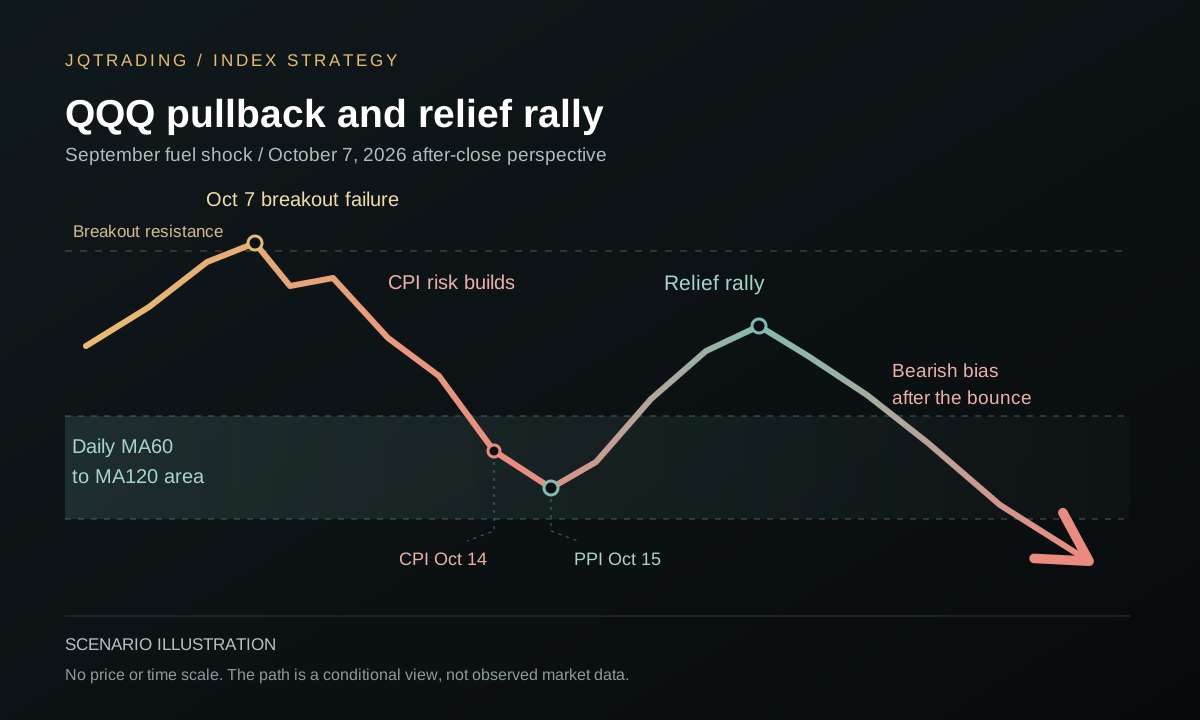
Our base case is a QQQ decline from the October 7 close into the October 14 CPI release window. September's rise in oil and pump prices is the reason we expect inflation concerns to build before the release. A failed breakout makes that pressure more important. We watch the daily 60-session to 120-session moving-average area for a possible low, then a relief rally around PPI on October 15.
The rally would not end our bearish view by itself. We expect the first recovery to face selling near the broken breakout area. If buyers fail there again, a further decline remains our preferred medium-term scenario.
The expected decline starts before CPI, as investors price the inflation risk. CPI may bring a final wave of selling. The rebound could start shortly before PPI or after its release if sellers lose control. This describes the overall direction; short bounces can occur during the downward phase.
What the exhibit shows
The expected path includes a strong bounce inside a broader bearish view. The moving-average area is a place to look for demand, while the failed breakout area is a later test of supply.
Investment interpretation
A selloff and a later rally can belong to the same correction. Treating every rebound as a new uptrend would miss that risk.
Limits and monitoring
The pattern is an analyst scenario. Price must confirm each stage. A breakout that holds, or a loss of the support area without a recovery, changes the expected path.
01 Technical premise
A failed breakout leaves buyers exposed
Our bearish case starts with price testing resistance, falling back below it, and failing to reclaim the area. Traders who bought the breakout may then use the next bounce to exit. That can make a small retreat develop into a faster decline.
We would look for weak daily closes and a rebound that stops below the earlier high. Expanding volume on down days would add support to the view. These are confirmation conditions; this report does not present a verified daily-price study of the breakout.
Our October 2 spread report already shifted attention toward pullback risk after the post-hike advance. This note develops a QQQ price-path scenario. NQ futures levels and a raw NQ–YM point spread cannot be used as QQQ price targets.
02 Event calendar
CPI comes on October 14 and PPI follows on October 15
The BLS calendar schedules the September CPI report for October 14, 2026, and September PPI for October 15. Both releases are at 8:30 a.m. Eastern time, or 5:30 a.m. Pacific time. October 13 is not the scheduled CPI date.
| Release | Date | Time | Role in our scenario |
|---|---|---|---|
| September CPI | October 14, 2026 | 8:30 a.m. ET / 5:30 a.m. PT | The expected downward phase runs from the October 7 close into this release window. CPI could add a final wave of selling. |
| September PPI | October 15, 2026 | 8:30 a.m. ET / 5:30 a.m. PT | A potential turning window. A relief rally could start shortly before or after the release if selling pressure fades. |
The calendar is a verified fact. The expected market reactions are JQTrading judgments. Neither release fixes the direction of the next session.
03 The selloff case
September fuel prices explain why we expect selling before CPI
The EIA's October 6 outlook was available before the October 7 close. It reported the following September averages, giving us a reason to expect pressure on headline inflation before CPI was released.
| Measure | September average | EIA observation |
|---|---|---|
| Brent crude spot | $114 per barrel | $23 per barrel higher than August. |
| U.S. retail gasoline | $4.35 per gallon | Retail prices rose during September. |
| U.S. retail diesel | $6.29 per gallon | Retail prices rose during September. |
The direct CPI link is retail motor fuel. BLS measures consumer fuel prices across the month; it does not insert the crude-oil price into CPI. Rising pump prices support our headline-inflation concern. Core CPI excludes food and energy, so an oil-price increase alone does not establish that core inflation will surprise.
Our timing judgment is that investors start reducing equity risk after the October 7 close and keep doing so into the October 14 CPI window. They do not need to wait for the release to react to fuel costs. A difficult CPI reading or a rise in yields could add selling at the end of this phase.
The main risk to this view is that energy inflation is already fully expected. High oil prices alone do not guarantee a CPI surprise or falling stocks. We would watch whether QQQ keeps making lower highs before the release and whether it begins to absorb bad news afterward.
04 Correction objective
Watch the daily MA60 to MA120 area for demand
Our downside reference is QQQ's daily MA60–MA120 area. MA60 means the simple average of the latest 60 regular-session closes. MA120 uses the latest 120 closes. These are trading sessions, not calendar days.
We watch the nearer average below price first. If it fails to hold, the other average becomes the next reference. The averages' actual order and values must be checked on the chart. An average above the market is not a downside target.
| Reference | What we want to see | What would change the view |
|---|---|---|
| MA60–MA120 area | Downside progress slows, then a daily close recovers the nearer support reference. | Repeated closes below the full area, followed by a failed recovery, weaken the bounce case. |
| First rebound | A higher low holds after the initial recovery. | Fresh lows after a brief bounce show that demand has not held. |
| Broken breakout area | A weak retest supports our later bearish view. | A sustained reclaim, followed by a successful retest, weakens the bearish thesis. |
A touch of either average is not enough to call a bottom. The averages also move as new sessions arrive. We keep the target in moving-average terms because verified October 7 MA values are not available in this report. We therefore do not attach an exact dollar target or drawdown percentage to the zone.
05 The rebound window
We expect a rebound around the PPI release window
After selling from the October 7 close into CPI, much of the near-term inflation concern may already be reflected in price. Our expected turning window is around PPI on October 15. The rebound could begin shortly before the release if the CPI reaction has already exhausted sellers, or after PPI if the market absorbs another inflation headline.
A softer report could help. A firm report could also be followed by a bounce if sellers cannot push price lower. We would focus on that response rather than assume that PPI must be good for the rally to occur.
We would look for QQQ to stop making fresh lows in the moving-average area and then form a higher low. That would support a relief rally. If selling continues through the full support area, the expected rebound must be delayed. The release date itself does not create a floor.
06 View after the bounce
We stay bearish unless the rebound repairs the trend
Our first reference for the recovery is the broken breakout area or the nearest clear resistance formed during the decline. We do not assume that the rally must return to the old high.
If the bounce loses strength there and forms a lower high, we would continue to expect another decline. Lighter volume on the recovery, together with renewed selling at resistance, would add support to that view.
We would change our stance if QQQ reclaims the failed breakout area, holds it on a retest, and forms a higher low. Broader participation would make that repair more convincing. A bearish opinion needs to change when the price structure changes.
07 Competing scenarios
The base case needs both support and resistance to matter
| Scenario | Expected path | Confirmation or failure |
|---|---|---|
| Base case | September fuel costs drive inflation concerns. QQQ declines from the October 7 close into October 14 CPI toward the MA60–MA120 area, rebounds around October 15 PPI, then faces renewed selling. | Support holds first. The later rebound fails near resistance. Both stages need confirmation. |
| Bull case | Inflation risk is absorbed and QQQ holds above the failed breakout area. The deep correction does not develop. | A successful reclaim and higher low invalidate the immediate bearish path. |
| Deeper bear case | QQQ loses the full moving-average area and PPI does not produce a lasting recovery. | Continued weak closes delay the rebound thesis and require a fresh support assessment. |
We do not assign numerical probabilities. This report has no complete signal sample or independent backtest from which to estimate them.
08 JQTrading positioning framework
Separate the correction trade from the later trend decision
From the October 7 close into CPI, our stance is defensive while the breakout remains unconfirmed and fuel-driven inflation concerns build. As CPI arrives and PPI approaches, a fast decline into the moving-average area would turn our attention toward selling exhaustion and a possible rebound.
Any rebound would begin as a tactical recovery in our framework. The later decision comes at resistance. A failed recovery supports the bearish view; a sustained reclaim requires us to reassess. The size of the first bounce alone does not settle that question.
Sources and timing
Information reference for the October 7 view
Analysis date: October 7, 2026, after the U.S. close. This report reconstructs that after-close scenario. Later CPI and PPI readings or price outcomes are not used to establish the scenario or to claim that it was correct.
The October 6 EIA outlook supplies the September energy observations and was available before the analysis reference date. The BLS calendar supplies the event dates, and its motor-fuel factsheet explains the consumer-price channel. Invesco supplies the fund description. The stock-market response, breakout failure, support, and expected sequence are analyst judgments to be tested. The illustration contains no historical price observations.
- EIA: October 6, 2026 Short-Term Energy Outlook, September oil and retail fuel observations, pages 5 and 7
- U.S. Bureau of Labor Statistics: How motor fuel prices enter CPI
- U.S. Bureau of Labor Statistics: October 2026 release calendar
- Invesco: QQQ and its Nasdaq-100 exposure
- JQTrading: October 2 NQ–YM spread outlook
- JQTrading: October 6 AI outlook