
Executive view: tactically bearish, pending confirmation
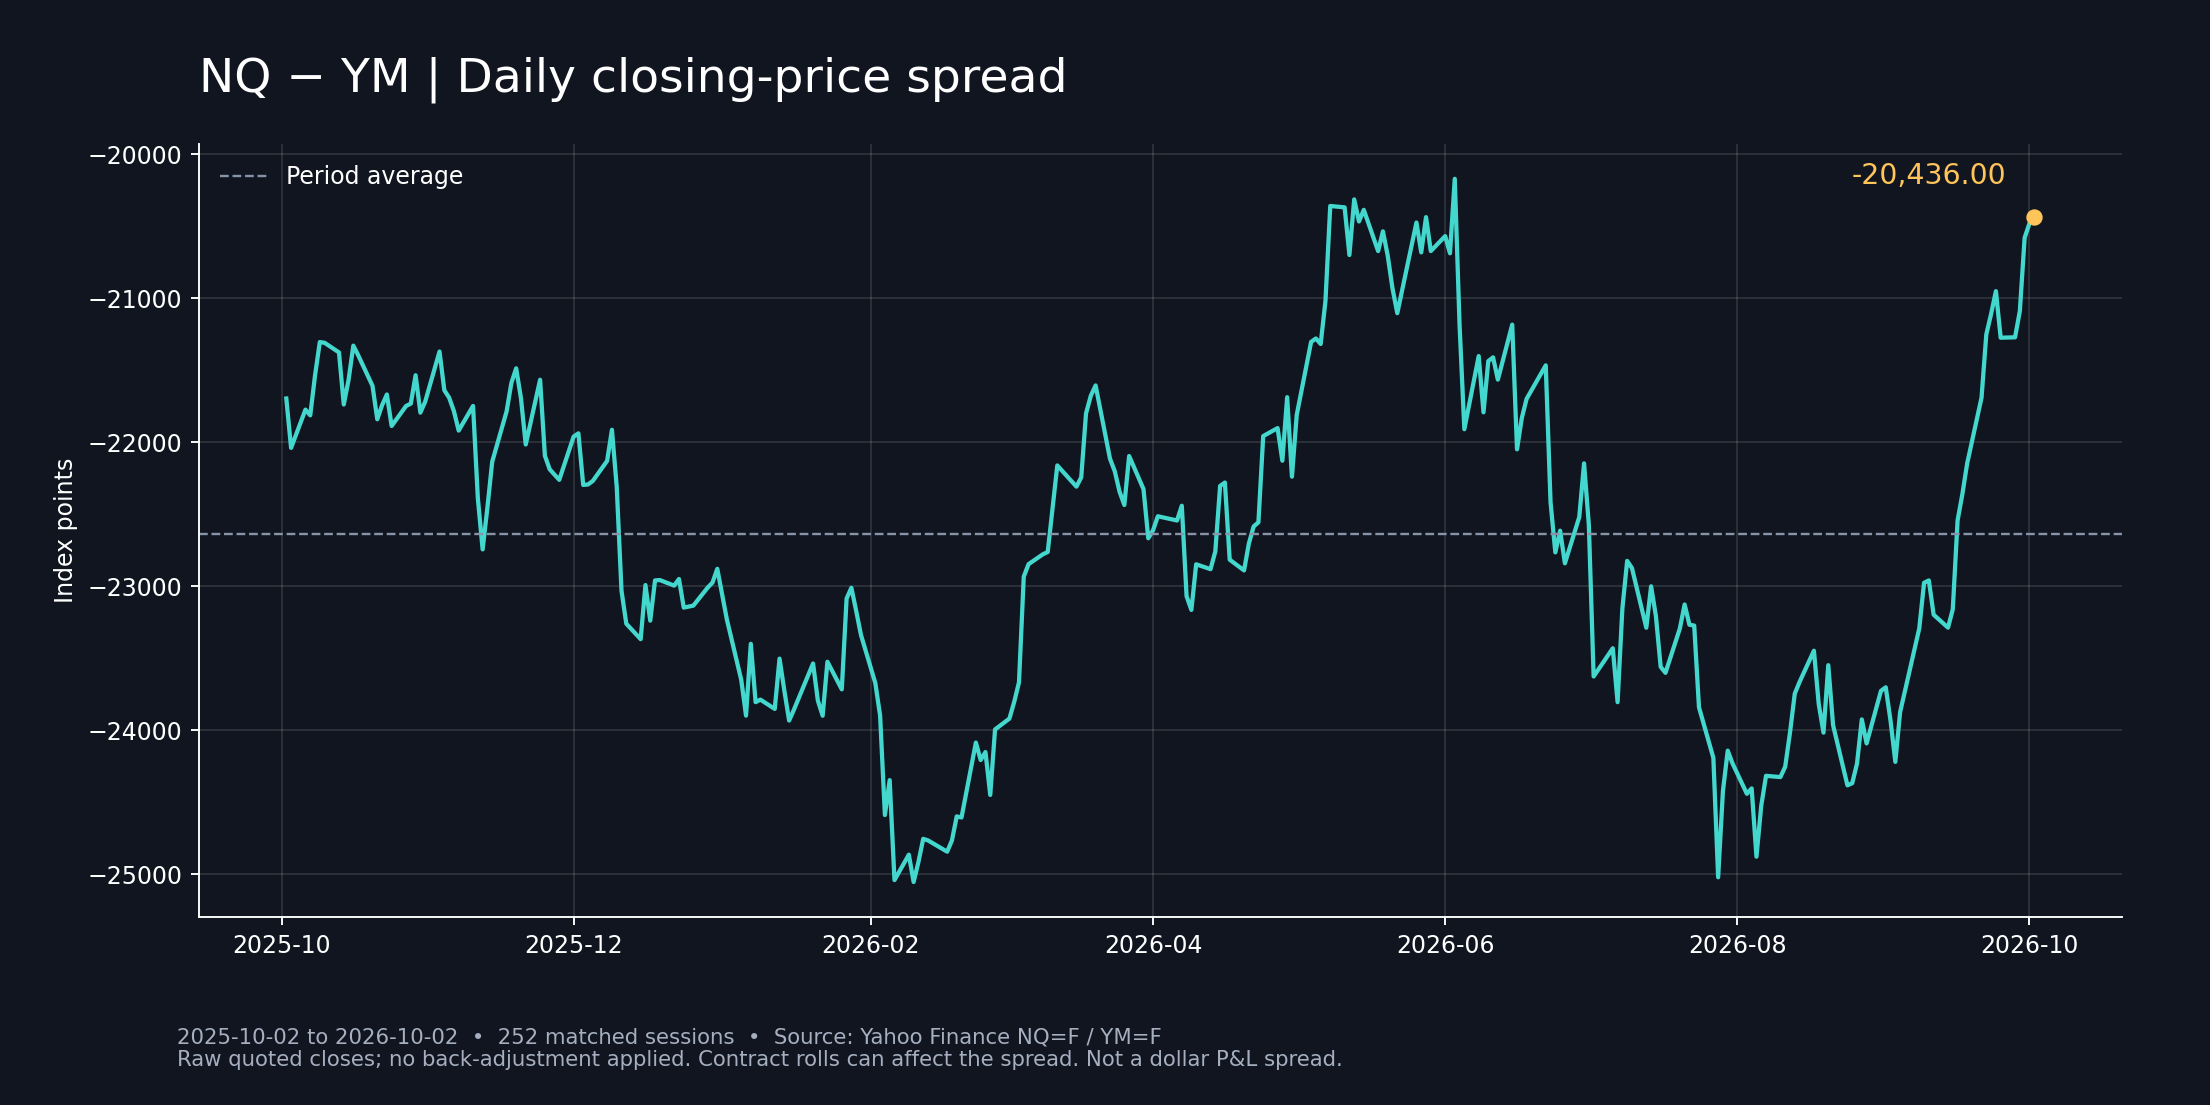
The NQ–YM spread has returned close to its June 2026 high. The post-hike technology rally has supported our earlier bullish direction. After that advance, our tactical focus shifts toward pullback risk. We consider two expressions: selling the point spread, or shorting NQ only after spread weakness coincides with a breakdown in NQ itself. The current reading is a risk warning; it does not establish that a downtrend has already begun.
Published October 2, 2026, Pacific time. Data through the October 2 close. Primary observation window: the next 5–20 trading sessions.
1. What “spread expansion” and “contraction” mean
We retain the original chart definition: S = NQ daily close − YM daily close, measured in index points. Because YM trades at a higher quoted index level, S is negative. In this report, an expanding or rising spread means S moves upward toward zero; contraction means S moves downward and becomes more negative. For example, −24,000 to −20,000 is a rise in S, while −20,000 to −22,000 is a decline. The absolute price distance |S| moves in the opposite direction. Always use the formula, rather than the word “wider,” to determine the trade direction.
A raw point spread is neither a percentage relative-return measure nor a valuation gap. S can rise because NQ rallies, or because YM falls more. It can fall simply because YM catches up while NQ remains positive. Spread contraction alone therefore cannot prove that an NQ selloff has started.
Prices are Yahoo Finance NQ=F and YM=F daily close fields, matched by New York trading date. No additional back-adjustment has been applied. Vendor closing conventions, contract rolls and futures basis can affect the observations.
2. Back near June’s high, without breaking it
| Metric | June 3, 2026 | October 2, 2026 | Interpretation |
|---|---|---|---|
| NQ close | 30,633.25 | 31,049.00 | 415.75 points above the June reference |
| YM close | 50,803.00 | 51,485.00 | 682 points above the June reference |
| S = NQ − YM | −20,169.75 | −20,436.00 | 266.25 points below the June spread high |
| One-year average S | — | −22,639.25 | Current spread is 2,203.25 points above its average |
| One-year empirical percentile | — | 98.02% | Based on 252 matched daily observations |
The accurate description is that the spread has returned to June’s high zone. It has not exceeded the June maximum. Approximately −20,700 to −20,170 is a historical observation band, defined from the current and June quotes; it is not an independently validated resistance level.
3. Three historical examples of subsequent pullbacks
We select the highest daily spread close within November 2025, March 2026 and June 2026, then compare NQ with its lowest close over the following 20 trading sessions. The observation window is identical for all three examples. These are retrospectively selected illustrations, not a complete signal sample or an independent out-of-sample test. The lowest subsequent close measures the pullback experienced within the window; it is not an achievable trading return and excludes intraday lows.
| Spread-high date | S at reference | NQ reference | Lowest subsequent NQ close / date | Point decline | Maximum closing pullback | Sessions to low |
|---|---|---|---|---|---|---|
| 2025-11-03 | −21,369.75 | 26,103.25 | 24,131.50 / 2025-11-20 | 1,971.75 | −7.55% | 13 |
| 2026-03-20 | −21,605.22 | 24,291.78 | 23,139.75 / 2026-03-30 | 1,152.03 | −4.74% | 6 |
| 2026-06-03 | −20,169.75 | 30,633.25 | 28,554.00 / 2026-06-10 | 2,079.25 | −6.79% | 5 |
November 2025: On November 3, S was −21,369.75 and NQ closed at 26,103.25. By November 20, NQ had fallen to 24,131.50, a 7.55% closing pullback. At that low, however, S had recovered to −21,693.50. An NQ pullback does not require the spread to decline every day.
March 2026: S reached −21,605.22 on March 20; NQ subsequently fell to 23,139.75 on March 30, a 4.74% pullback. The lead-in matters: from March 2 to March 20, NQ had already fallen 2.93%, while YM fell 6.23%. The rise in S mainly reflected greater weakness in YM, rather than an overheated NQ rally. March 20 was also near quarterly contract expiry, so the quote and roll conventions warrant further verification.
June 2026: On June 3, S reached −20,169.75 and NQ closed at 30,633.25. NQ then fell to 28,554 on June 10, down 6.79% in five sessions. This is the closest comparison to today’s spread level. Extending the window to 40 sessions produces a July 29 low of 27,342, down 10.74%; that longer-window result is excluded from the 20-session summary above.
4. How much downside remained after confirmation?
For reproducibility, we use an illustrative confirmation rule: after the reference high, S must close at least 300 points below that high for two consecutive sessions. The second session is the confirmation date. The 300-point threshold is a research assumption, not an optimized or out-of-sample-validated parameter. We then measure both the lowest NQ close over the next 20 sessions and its return at session 20. This rule checks the spread only; execution must also check whether NQ itself is weakening.
| Reference case | Confirmation date | S at confirmation | NQ at confirmation | Subsequent 20-session low / date | Maximum post-confirmation pullback | NQ return at session 20 |
|---|---|---|---|---|---|---|
| 2025-11-03 | 2025-11-06 | −21,783.75 | 25,244.25 | 24,131.50 / 2025-11-20 | −4.41% | +1.93% |
| 2026-03-20 | 2026-03-24 | −22,201.25 | 24,213.75 | 23,139.75 / 2026-03-30 | −4.44% | +11.85% |
| 2026-06-03 | 2026-06-05 | −21,909.50 | 29,026.50 | 28,554.00 / 2026-06-10 | −1.63% | +1.26% |
| Statistic | From spread-high reference | From confirmation close |
|---|---|---|
| Mean maximum 20-session closing pullback | −6.36% | −3.49% |
| Median maximum 20-session closing pullback | −6.79% | −4.41% |
| Number of examples | 3 | 3 |
The difference matters for execution. By June 5 confirmation, NQ had already declined about 5.25%, from 30,633.25 to 29,026.50. The remaining maximum closing pullback over the next 20 sessions was only 1.63%. A late entry cannot reasonably assume that the entire 6.79% decline measured from the earlier reference remains available.
All three examples had positive NQ returns by the twentieth session after confirmation. They support the possibility of a temporary pullback, but do not establish a persistent 20-session downtrend or a profitable fixed-horizon short strategy.
5. The earlier bullish direction has received support
Our September 18, 2026 report, The Hike Is Done. QQQ’s Next Uptrend Starts Here, argued that the completed policy decision reduced near-term event uncertainty and created a window for technology strength. Its main instrument was QQQ, with 720–723 as the first target and decision band. That band had already been reached on the publication date; it should not be presented as a target first achieved afterward.
| Tracked measure | September 18 | October 2 | Change |
|---|---|---|---|
| NQ close | 29,613.68 | 31,049.00 | +4.85% |
| YM close | 51,761.00 | 51,485.00 | −0.53% |
| NQ − YM | −22,147.32 | −20,436.00 | +1,711.32 points |
NQ’s subsequent 4.85% advance supports the earlier technology-strength direction. QQQ and NQ are different instruments: this comparison supplements index-direction tracking, rather than replacing a full review of the QQQ report’s conditions. It also does not establish that the hike caused the advance.
The Federal Reserve raised its target range by 25 basis points to 3.75%–4.00% on September 16. “The hike is done” refers to that specific decision having occurred, not to the entire tightening cycle having ended.
We now change the tactical focus: the earlier phase favored post-event upside; the current phase asks whether an elevated spread can persist and whether technology leadership is starting to fade. Our near-term bias turns bearish, with confirmation required for a directional short. Continued spread expansion and sustained new NQ highs would invalidate the pullback-entry plan.
6. Two strategy frameworks
| Item | Strategy A: sell the point spread | Strategy B: short NQ after confirmation |
|---|---|---|
| Objective | Benefit from a decline in S = NQ − YM | Benefit from a decline in NQ itself |
| Trigger | S rejects the high observation band and falls below its five-session average; evaluate with limited initial exposure | S closes at least 300 points below its latest 20-session high for two sessions, while NQ closes below its 10-session average and the lowest close of the prior five sessions |
| Direction | Short NQ and long YM, with contract multipliers and expiries checked | Short NQ; no trigger if S falls while NQ continues rising |
| Reference objectives | S around −21,500 first, then −22,000 to −22,650 | A 3%–5% decline from the actual trigger price; reassess 5%–7% only if weakness persists |
| Invalidation | S breaks above its pre-entry high and fails to reverse back below it | NQ recovers the breakdown area, or accepts a new high while S rises again |
| Exit discipline | Set a combined dollar-loss limit; do not leave an unplanned single leg open | Size from the actual entry and structural stop; do not treat a historical hindsight low as an achievable exit |
| Main risks | Raw spread instability, unequal directional and volatility exposure, and contract-roll distortion | False breakdowns, rebounds, delayed confirmation, and earnings or news that sustain strength |
Strategy A requires careful sizing. NQ is worth $20 per index point and YM $5. To reproduce the original one-for-one point spread mathematically, the combination is short one NQ and long four YM: combined P&L = −20 × change in S, before costs. If NQ falls 1,000 points and YM falls 400, S falls 600 points and that combination gains $12,000.
That combination is not dollar-neutral. At the current reference prices, the short notional is approximately $620,980 and the long notional is $1,029,700, leaving net long notional of about $408,720. If both indexes decline 1%, it loses roughly $4,087. A paired position can therefore retain substantial market exposure.
For percentage relative-strength trading, estimate a rolling beta and size by notional value. A simple equal-notional comparison at current prices gives roughly 2.41 YM contracts per NQ, before integer-contract approximation. That is a different spread from the chart’s one-for-one index-point difference and must be evaluated separately. Short one NQ and long one YM is not a fully hedged position. Use matching expiry months and account for margin, commissions and slippage.
Strategy B separates the warning from the entry. Spread weakness flags fading leadership; an NQ breakdown checks the absolute direction. A failed retest of the breakdown area can be assessed as an entry setup. If confirmation follows an unusually large drop, do not assume the entire decline measured from the original high is still available.
7. Pullback scenarios for the current setup
Using the October 2 NQ close of 31,049 as a reference, the three selected high-point examples produced maximum 20-session closing pullbacks of approximately 4.74%–7.55%, with a median of 6.79%. After confirmation, remaining maximum pullbacks ranged from 1.63% to 4.44%. We therefore use a 5%–7% correction from the current high reference as the base bearish scenario, and 3%–5% from the actual confirmation price as a more cautious execution reference. These are historical analogies and research judgments, not model-derived probability intervals.
| Scenario | Decline from 31,049 | NQ reference range | Condition / interpretation |
|---|---|---|---|
| Mild pullback | 3%–4% | 30,118–29,807 | Spread retreats while underlying technology trend support remains intact |
| Base bearish case | 5%–7% | 29,497–28,876 | Spread weakness and an NQ daily breakdown align; observe over 5–20 sessions |
| Deeper correction | 7.5%–10% | 28,720–27,944 | Selling persists and rebounds fail; closer to June’s extended 40-session example and may take longer |
| Bearish thesis invalidated | No downside target | Use the prevailing new high / breakdown area | Spread breaks beyond June’s reference high and NQ accepts sustained new highs |
If NQ has already fallen to 30,000 when confirmation occurs, a 3%–5% post-confirmation decline should be recalculated as 29,100–28,500. It should not continue to be measured mechanically from 31,049. Before confirmation, the ranges are planning scenarios; reaching them does not guarantee a bottom.
8. Conclusion and daily monitoring
Tactically bearish, with execution pending confirmation. The earlier post-hike upside direction has received support, while the spread is now back near June’s high zone. Our focus shifts from chasing the advance toward spread reversion and a possible temporary NQ correction. The two frameworks are selling the point spread, or considering an NQ short after both spread contraction and an NQ breakdown. The base scenario is a 5%–7% decline from the current reference, toward 29,497–28,876; after confirmation, use the actual trigger price and a more conservative target.
Spread contraction cannot prove that NQ must fall. Three selected examples cannot establish a win rate, and an interim decline does not mean a short held to the end of the window is profitable. Further work should test every signal, non-signal periods, parameter sensitivity and transaction costs on consistent same-expiry contract data. This report does not claim an independently validated profitable strategy.
| Daily check | Supports the bearish case | Weakens the bearish case |
|---|---|---|
| Spread S | Consecutive lower closes, at least 300 points below the recent high | Persistent strength or a break above the −20,169.75 June reference |
| NQ price structure | Below the 10-session average and prior five-session lowest close; failed retests | New highs accepted, or the breakdown quickly recovered |
| Source of spread weakness | NQ falls in absolute terms and weakens against YM | YM simply catches up while NQ keeps advancing |
| Data consistency | Both legs use matching expiry months and closing times | The apparent signal comes from a roll or mismatched quote times |
Data, calculation conventions and sources
Prices were downloaded after October 2, 2026. The one-year comparison includes 252 matched daily closes from October 2, 2025 to October 2, 2026. Closing pullback = lowest subsequent close / reference close − 1. Fixed-window return = session-20 close / reference close − 1. Empirical percentile = share of sample observations no higher than current S. Low searches begin with the session after the reference or confirmation. Examples exclude trading costs. No win rate, statistical significance or achievable strategy return has been estimated.
- Yahoo Finance NQ=F daily data and YM=F daily data. Vendor close fields have not been independently checked against every underlying trade.
- JQTRADING: The Hike Is Done. QQQ’s Next Uptrend Starts Here, September 18, 2026.
- Federal Reserve FOMC statement, September 16, 2026.
- CME E-mini Nasdaq-100 and E-mini Dow contract specifications.
This report provides market research and scenario analysis. Historical and hypothetical outcomes do not guarantee future results. Futures leverage and paired positions can produce substantial losses.