
Executive view
We think the third downward leg is unfinished.
Our October 28 report warned that another disappointing earnings response could damage sentiment and extend NQ's decline. The subsequent reaction is consistent with that concern. Our focus now shifts to the possible structure of the selloff: a downward five-wave pattern, with the third wave underway from the October 28 high.
Reuters' October 30 market report linked the technology selloff to disappointing Intel and Amazon results and renewed concern about AI spending. It reported a 28.6% decline in Intel shares and a 7.2% fall in the semiconductor index. [1] This supports the earnings-risk backdrop; it does not validate a particular wave count or guarantee the remaining downside.
The chart measures wave 1 at approximately 2,641 points. Against the analyst's estimate that wave 3 has already fallen about 1,900 points by the October 30 close, a wave-1-sized third leg would leave about 741 points. We round this to roughly 700 points in our preferred scenario. Wave 3 could extend further, but it could also finish earlier.
The reference chart
Only the first two waves are treated as completed in this count.
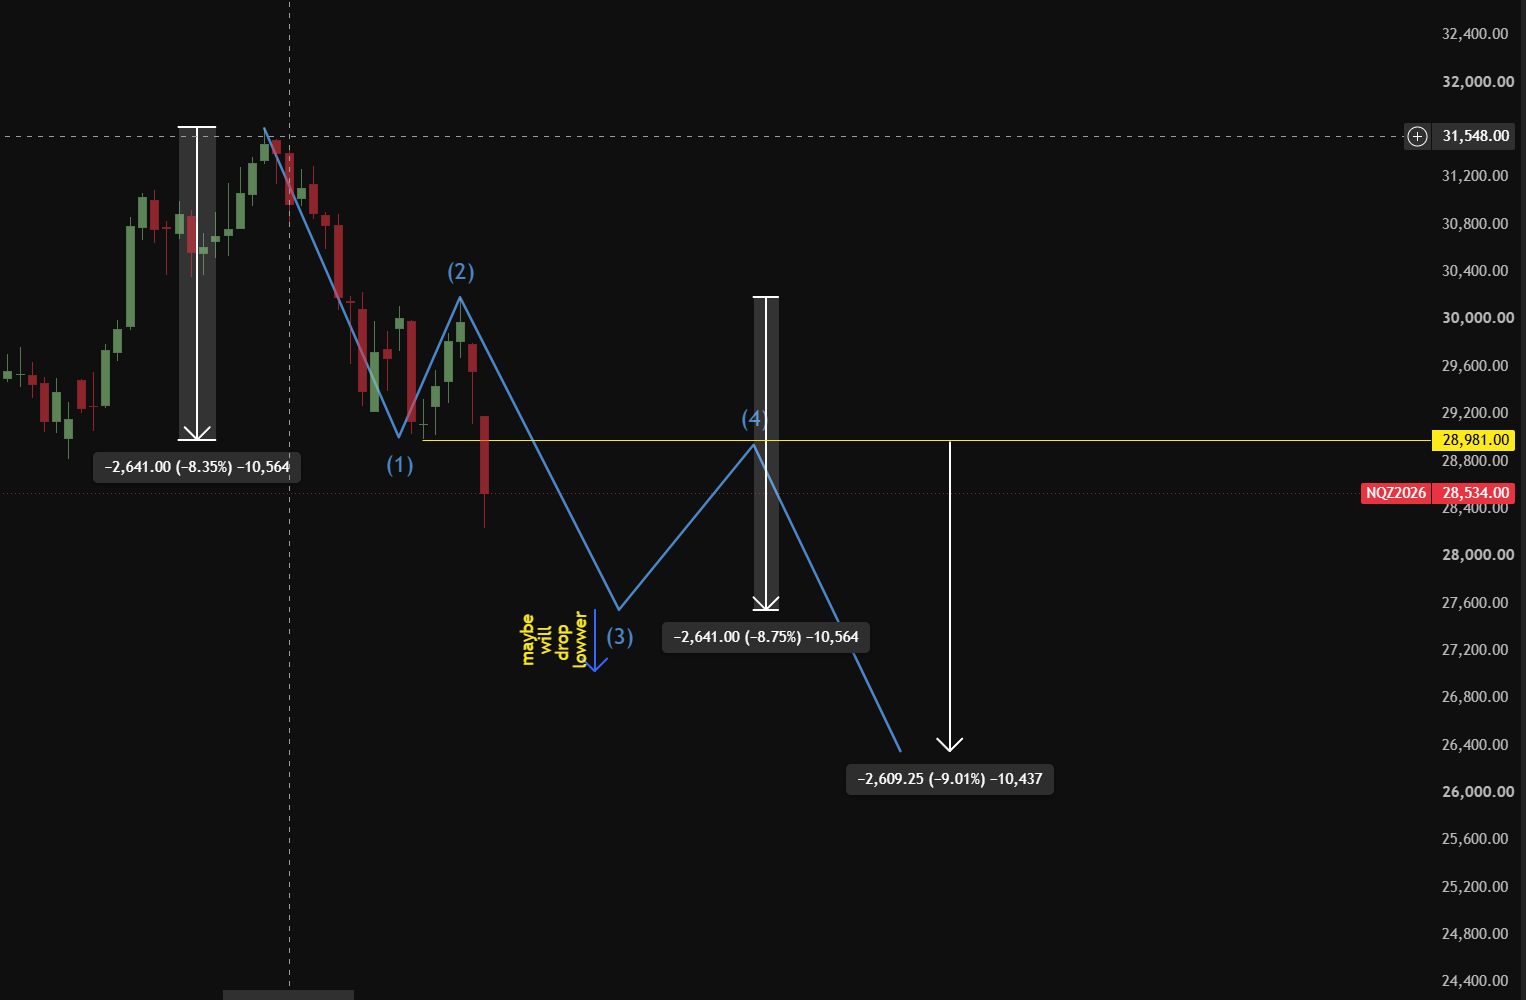
| Wave | Our proposed count | Status at this observation point |
|---|---|---|
| 1 — Initial decline | October 6 high to October 22 low; roughly 2,500–2,600 points, measured at about 2,641 on the chart. | Provisionally complete. |
| 2 — Corrective rebound | Recovery from the first-wave low into the October 28 high. | Provisionally complete. |
| 3 — Renewed decline | Begins at the October 28 high; approximately 1,900 points of decline in the analyst's closing-view estimate. | In progress; its endpoint is not known. |
| 4 — Corrective rebound | A future upward correction after wave 3 ends. | Projected; neither its starting point nor its ending point is confirmed. |
| 5 — Final downward leg | A possible decline after wave 4 completes. | Projected; a numerical target must wait for the preceding legs. |
Five waves, briefly explained
Three trend legs separated by two corrections.
In a bearish five-wave framework, waves 1, 3 and 5 move downward, while waves 2 and 4 interrupt the decline with upward corrections. This is a way of organizing a proposed trend structure, not a rule that prices must follow the drawn path. A rebound can be part of a declining sequence rather than the start of a new uptrend.
In the standard motive-wave rules, wave 3 cannot be the shortest of the three directional legs: 1, 3 and 5. It does not have to be the longest. Wave 2 also must not fully retrace wave 1. [2] Applying a wave count requires identifying its actual turning points; provisional labels can need revision.
For a standard non-diagonal impulse, wave 4 does not overlap wave 1's price territory. In a declining impulse, the relevant boundary is the end of wave 1, which is also the starting point of wave 2, rather than the peak ending wave 2. [3] Our closing-price adaptation below is an author-defined trading filter and should not be confused with the strict textbook rule.
Two possible third-wave lengths
Wave 3 may extend, or a shorter third wave may constrain wave 5.
Scenario A: wave 3 equals or exceeds the first leg. This is the path we currently favor. A full first-wave-sized move from the October 28 high would imply more decline than the roughly 1,900 points already counted. A third-wave extension could carry price below the endpoint drawn in the chart. Reaching the equal-leg reference would not, by itself, prove that wave 3 had ended or wave 4 had started.
Scenario B: wave 3 finishes shorter than wave 1. A fourth-wave rebound could begin before the first-wave distance is matched. In that case, a fifth wave shorter than wave 3 would preserve the length relationship required by our proposed impulse count. A later fifth leg longer than that shorter third leg would invalidate this count rather than force the market to obey the drawing.
The comparison must use the same measurement basis. We use point distances on this futures chart. “Less than 2,600 points” is shorthand, not an independent threshold: the actual first-wave benchmark shown is about 2,641 points. Equal-leg projections are estimates; no rule requires wave 3 or wave 5 to copy wave 1 exactly.
The remaining-distance estimate
Why our present forecast is roughly 700 points or more.
Wave 1 measurement ≈ 2,641
Wave 3 decline already estimated ≈ 1,900
Distance to a first-wave-sized third leg ≈ 2,641 − 1,900 = 741 points
That is the arithmetic behind our roughly 700-point remaining-downside view. If one used only the coarser 2,500-point estimate, the remainder would instead be about 600. We use the chart's more specific measurement to keep the stated forecast consistent with the illustration.
Our preference is for wave 3 to complete a comparable or greater decline. It is not a minimum imposed by Elliott rules: the shorter-third-wave scenario remains possible. Nor is the calculation a prediction of when the next 700 points will occur. The third wave could be interrupted by smaller rebounds before a larger fourth-wave correction develops.
Our modified fourth-wave filter
A daily close above approximately 28,970 would fail this setup.
We adapt the overlap idea into a closing-price test. For the proposed fourth-wave rebound, our operative ceiling is the October 23 low area near 28,970, with the screenshot's horizontal reference at 28,981 illustrating approximately the same area. A daily close above this working ceiling would invalidate our custom short-continuation setup and require a recount.
The broader 29,000–29,200 band is a resistance area to watch, not permission for wave 4 to close anywhere inside it. The tighter 28,970-area closing ceiling takes precedence. An intraday probe toward that band that closes back below the ceiling could remain acceptable under our custom filter, while still being different from strict textbook non-overlap.
If a fourth-wave rebound approaches resistance, fails to hold above it and then turns lower, we would regard that rejection as a potential short-continuation setup within this framework. We cannot identify that opportunity in advance simply by drawing wave 4. First, wave 3 must show signs of ending; then the rebound and its rejection must become observable.
What we can and cannot project now
Do not fix wave 5 before wave 4 exists.
The chart uses the first-wave distance as an initial measuring guide for projected legs 3 and 5. Those lines are a roadmap, not confirmed targets. In particular, if wave 3 proves shorter than wave 1, the fifth-wave placeholder must be shortened to remain consistent with our count.
We need the actual third-wave low and a clearly developed fourth-wave rebound before estimating the fifth leg from a credible starting point. A turn down from that rebound, together with respect for the closing ceiling, would allow a more useful fifth-wave assessment. Until then, the fifth-wave price and timing remain open.
Our present conclusion is narrower: we remain bearish, treat wave 3 as unfinished and favor roughly another 700 points or more in the comparable-leg scenario. We will reassess when a substantial upward correction begins. A failed count or a close above the custom ceiling is a reason to revise the forecast, not to relabel every move until the original target appears correct.
Sources and methodology
- Reuters, October 30: Wall Street closes sharply lower as AI cash-burn fears spark a technology selloff. Context for the completed session.
- Elliott Wave International: Motive Waves. Five-wave structure and directional-wave length constraints.
- Elliott Wave International: Impulse. Standard overlap rule.
The chart, turning-point dates and approximately 1,900-point third-wave estimate are analyst-supplied. The screenshot is a reference illustration, not a verified settlement record. The roughly 700-point forecast is conditional on the chosen measurement scenario. Our 28,970-area closing filter modifies the standard rule, so this is Elliott-inspired analysis rather than a claim of strict textbook validation. Futures involve leverage and substantial risk; this report is research commentary.